Stock Market Outlook entering the Week of September 8th = Downtrend
- ADX Directional Indicators: Downtrend
- On Balance Volume Indicator: Mixed
- Institutional Activity (Price & Volume): Downtrend
ANALYSIS
The stock market outlook entered a downtrend last week, after encountering heavy selling pressure throughout the week.
The S&P500 ($SPX) fell 4.2% last week (oof!). The index sits ~2% below the 50-day moving average and ~5% above the 200-day moving average.

The Average Directional Index (ADX) flipped to a bearish signal thanks to the selling on Tuesday. On-Balance Volume (OBV) shifted to a mixed signal on Friday, testing its moving average cross-over point.
Institutional activity also switched to to bearish, adding 2 more distribution days and failing to find support at the 50-day moving average (on higher than average trading volume no less).
All in all, the weakness isn’t surprising given last week’s outlook:
The ADX shows a weak trend in place, (and) the young rally already has 3 distribution days…neither of those two data points are highly supportive of a rally or a market making new all time highs.

A few pockets of strength emerged in last week’s sell off, including Consumer Staples, Real Estate, and Utilities ($XLP, $XLRE, $XLU). Technology ($XLK) and Energy ($XLE) led to the downside. The relative performance of the sectors above, month over month, suggests a deflationary environment within U.S. stocks.

High Dividend stocks led to the upside, if you can call breakeven “outperformance”. All other sector styles fell, though some managed to beat the overall index. High Beta and Small Cap Growth names dropped the most. On a month over month basis, the relative strength of sector style shows a deflationary regime in place, with Low Beta and Dividend Yield outperforming and underperformance from High Beta and Growth.

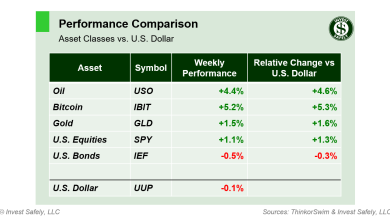
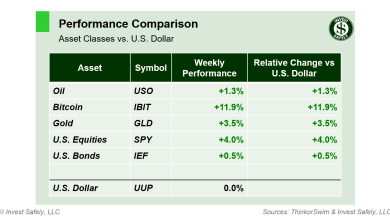
Bonds were the only asset class to register gains last week, while oil edged out bitcoin for the worst performer. On a month over month basis, the relative strength of asset classes shows a deflationary regime in place.
COMMENTARY
ISM Manufacturing PMI rose slightly versus July, but was down year over year, showing a contraction in manufacturing activity for 21 of the past 22 months.

A similar story for ISM Services PMI, with the monthly comparison up slightly and the yearly lower. An overall reading above 50 shows an expansion in services, albeit a small one.

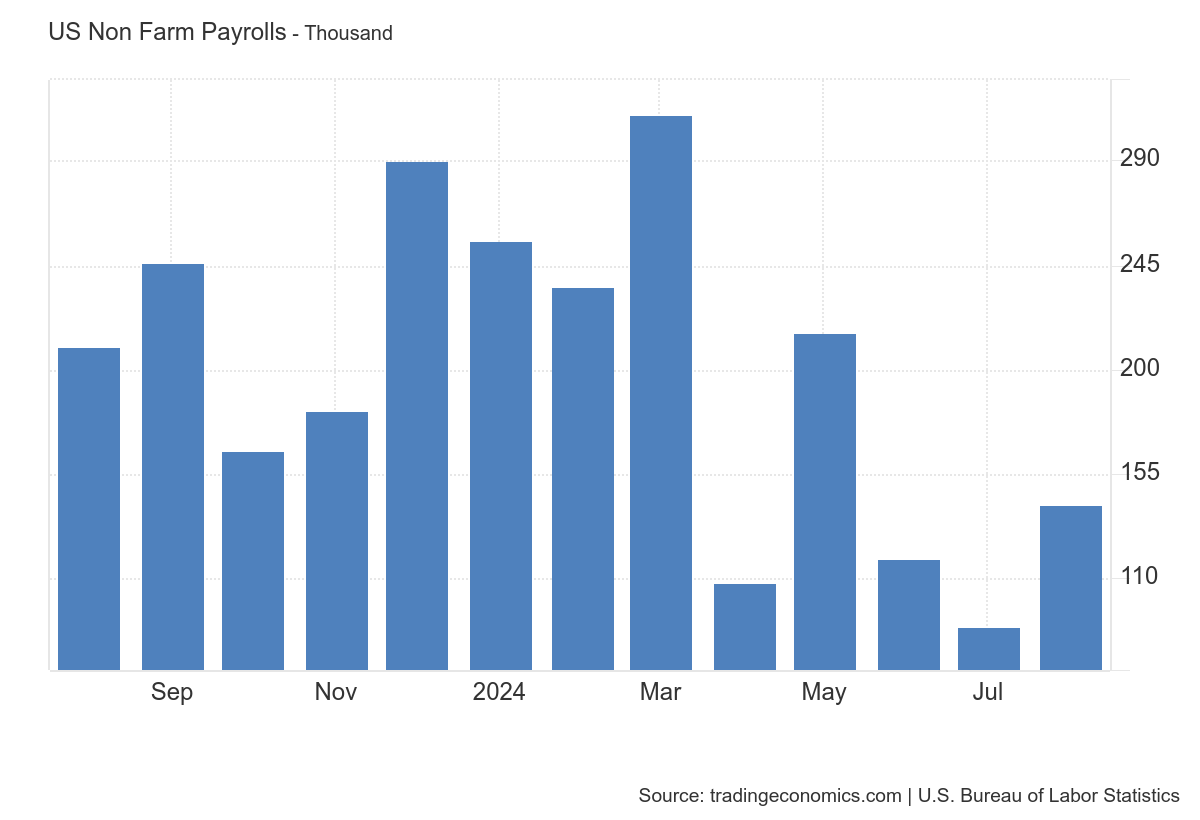
Jobs data came in a bit weaker than expected, which adds pressure on the Federal Reserve to cut rates at their next meeting. The number of job openings (JOLTS) in July fell verses June and 2023 levels, hitting the lowest level since January 2021. Non-Farm payrolls shows an increased in employment verses last month, but a decreases versus last year.

This week, U.S. BLS releases the latest CPI and PPI.
Best to Your Week!
P.S. If you find this research helpful, please tell a friend.
If you don’t, tell an enemy.