Stock Market Outlook entering the Week of September 15th = Uptrend
- ADX Directional Indicators: Uptrend
- On Balance Volume Indicator: Uptrend
- Institutional Activity (Price & Volume): Mixed
ANALYSIS
The stock market outlook flipped back to an uptrend late last week, after sustained buying pressure almost every afternoon kept volatility levels elevated and flipped 2 of the 3 indicators.
The S&P500 ($SPX) rallied 4% last week. The index sits ~2% above the 50-day moving average and ~9% above the 200-day moving average.

The Average Directional Index (ADX) flipped back to bullish on Friday, but the overall trend is weak due to the back and forth price action since mid-August. On-Balance Volume (OBV) moved back to bullish on Wednesday, after testing its moving average cross-over point.
Institutional activity was bullish, but not enough to flip the signal to an uptrend. The follow-through day came one day to early (Day 3 of the rally attempt), but the market has all week to try again.

Technology ($XLK) led to the upside by a wide margin, while Energy ($XLE) lagged, as mega cap technology stocks continue to have an outsized influence on market performance. The strength in discretionary ($XLY) stocks is a bit surprising, but likely reflects expectations of rate cuts and subsequent consumer spending.

High Beta was the best sector style, and serves as a reminder that upside volatility is still volatility (i.e. the $VIX is elevated). The prior week’s winners (Low Beta and High Dividend) were this week’s “losers”, registering a 1.5% gain.

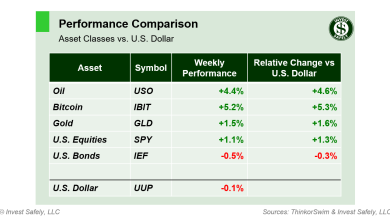
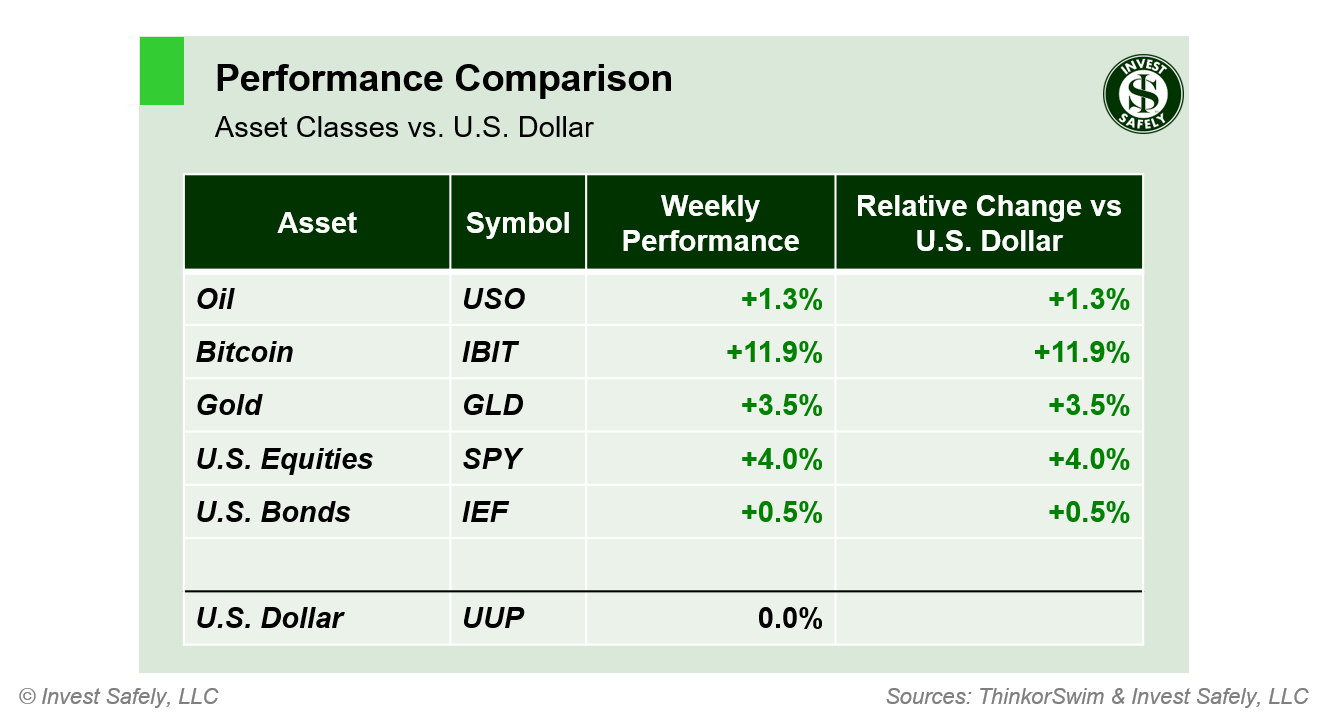
Every asset class outperformed last week, with Bitcoin gaining more than 10% for the week! Bonds only managed a gain of 0.5%, as the coming rate cuts have already been fully priced into the market. Keep an eye on commodities; a recovery in something like oil would indicate a shift from the current deflationary environment to a stagflation regime.
COMMENTARY
The consumer price index (CPI) fell for the fifth month in a row, down to 2.5% y/y in July. Core CPI was flat.
| CPI (y/y) | Actual | Prior |
Expected |
| Headline | +2.5% | +2.9% | +2.6% |
| Core | +3.2% | +3.2% | +3.2% |
Headline producer prices (PPI) fell July, while Core PPI rose (*Core & Headline figures revised down 0.1%).
| PPI (y/y) | Actual | Prior |
Expected |
| Headline | +1.7% | +2.1%* | +1.8% |
| Core | +2.4% | +2.3%* | +2.5% |
It’s FOMC week, and the slowing headline inflation data guarantees a rate cut this Wednesday, along with some volatility before and after the Powell press conference. Now the only question is how many basis points and how often.
Best to Your Week!
P.S. If you find this research helpful, please tell a friend.
If you don’t, tell an enemy.